iOS concept · Climate data · Personal project

Climate data, made human.

Scroll, swipe or press space
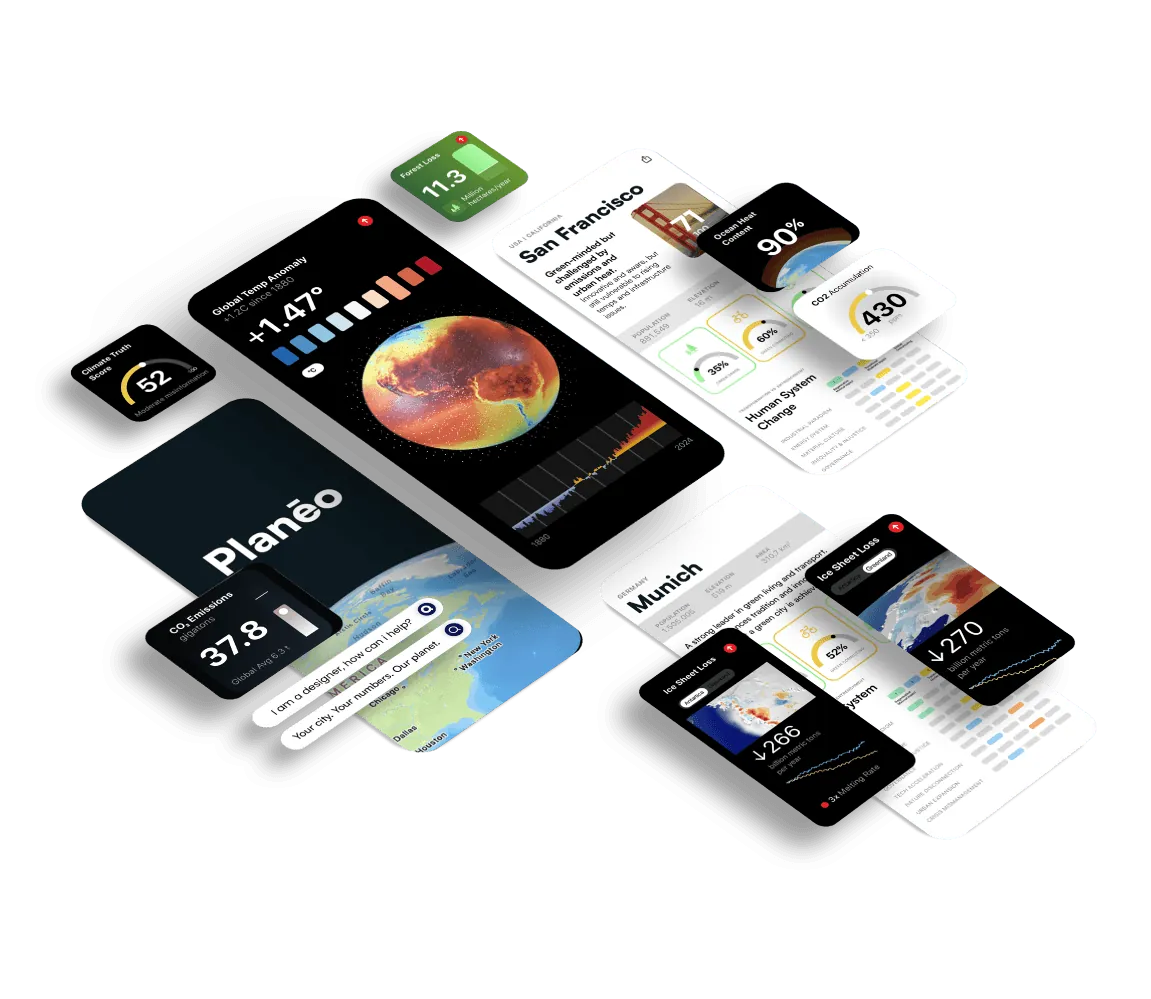
Planēo screens in an isometric spread: the global temperature globe, CO₂ and ice-sheet widgets, city profiles for San Francisco and Munich, and the map with the assistant

02 · The idea

What if climate data worked like the weather app?

Type
iOS concept
Domain
Climate, UX
Data
Live, real-time
Status
Concept

Global Temp Anomaly

+1.2C since 1880

↑

+1.47°

ColdHot
18802024

Sea Level

Since 1993

↑

+101 mm

Arctic Ice

Extent

↓

4.8 M km²

CO₂ Emissions

gigatons

37.8

Global Avg 6.3 t

CO₂ Level

Target <350 ppm

430

ppm

GHG Emissions

GtCO₂e/year

↑

59

Net zero by 2050

Locating…

Live weather

--°

Loading…

--%-- km/h

Nitrous Oxide

N₂O

↑

338.5 ppb

Methane

CH₄

↑

1,900 ppb

03 · The dashboard

Every reading comes with its causes, its trend and three scales: global, country, your city. The weather card is live for wherever you are.

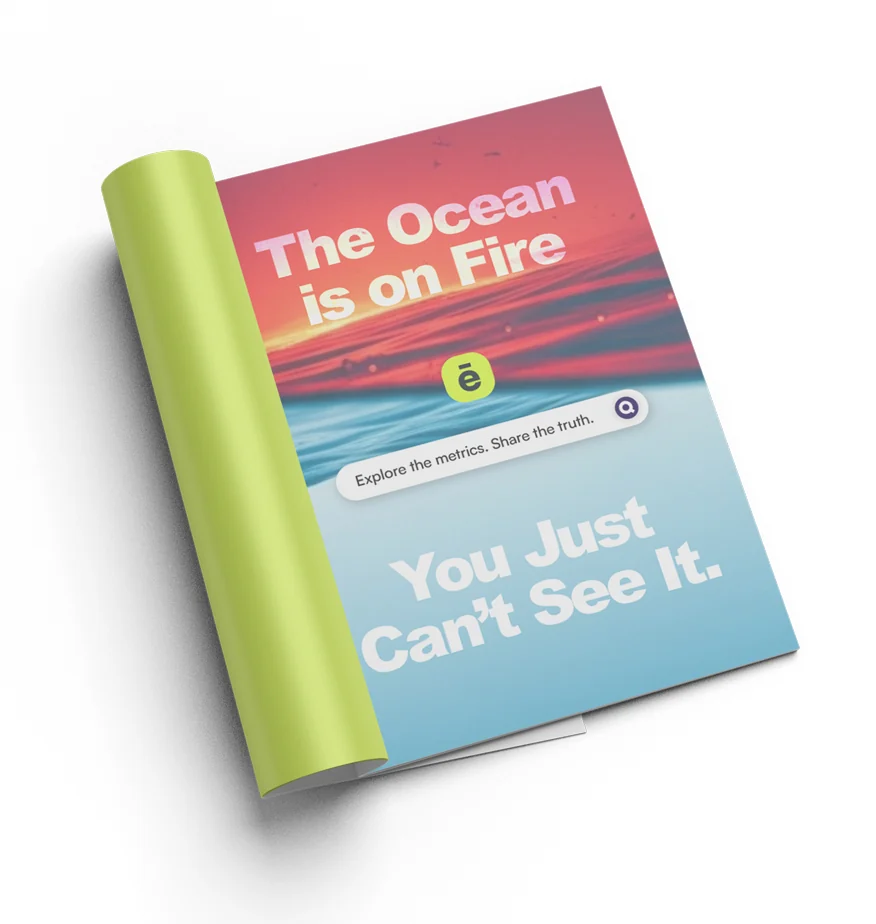
A magazine open to a full-page Planēo ad: a burning red sea over calm blue water, “The Ocean is on Fire” above the app’s search bar reading “Explore the metrics. Share the truth.”, and “You Just Can’t See It.” below

04 · The campaign

The ocean is on fire. You just can’t see it. The app’s search bar sits between the two lines, where the data would show you.

05 · Who it’s for

Three people, one question: what do the numbers mean for me?

LuciaCurious citizen
“I know climate change is real but I don’t know what the numbers mean or whether things are getting better.”

JonasStudent, researcher
“I want data I can trust, at the right scale, city, country, global, without digging through scientific papers.”

AminaClimate-aware parent
“I want to show my kids what’s actually happening to the planet, in a way that feels real, not abstract.”
Planēo 01 / 05